For all projects acquired at the MRI Centre, quality reports on MRI data are generated. These reports concern T1w and T2w anatomical images, as well as BOLD images. These reports are generated with the MRIQC software: https://mriqc.readthedocs.io/en/stable/
The generated reports allow a quick visualization of the quality of the data produced at individual and group level and are as follows:
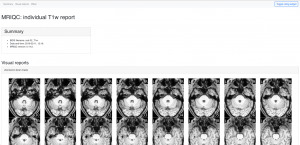
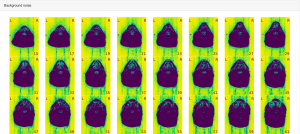
-Individual reports: example of a T1w report: screenshots of the magnitude image and the background noise make it possible to detect possible problems at a glance.
-Group reports: example of a group report of a set of functional runs for all the subjects of a study: the distribution of points for each metric makes it possible to detect possible outliers and to take them into account for the analyses which will be carried out.
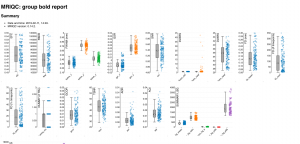
Researchers are encouraged to first read the “bold_group.html” file which presents information from all BOLD runs and may help to detect outlier scans before attacking the post-processing steps. These documents are interconnected and if you click on a point in the group graphs you will be sent to the page for the detailed report of the image in question. Similarly, if you click on the acronym of a parameter (EFC, FWHM, DVARS…) in the upper left corner of a graph, you are sent to the parameter definition on the MRIQC website.
A quick definition of these metrics and how they are calculated can be found here:
https://mriqc.readthedocs.io/en/stable/measures.html
A quick definition of these metrics and how they are calculated can be found here:
https://mriqc.readthedocs.io/en/stable/measures.html